Create & Customize: Dashboard Labels
In the dynamic world of data visualization and analytics, dashboards have emerged as powerful tools enabling users to track, analyze, and interpret data with ease. A dashboard, essentially, is an information management interface that consolidates and presents key performance indicators (KPIs), metrics, and other vital information in a single, real-time display. But a dashboard's effectiveness is not just determined by the data it presents; it's also heavily influenced by the labels and titles assigned to its components. These labels, often overlooked, play a critical role in enhancing both the functionality and user experience of a dashboard.
Dashboard labels, when used effectively, can greatly simplify complex data, providing users with quick insights and guiding them through the interface. They serve as a bridge between the data and the user, facilitating understanding and interaction. This article explores the intricacies and benefits of dashboard labels, offering best practices and tips to optimize your dashboards.
Understanding Dashboard Labels
In essence, a dashboard label is the text description or name given to a data visualization or KPI on a dashboard. It's the first point of contact between a user and the data, providing immediate context and description. Labels can be as simple as a line or bar chart title, or as complex as the legend entries or tooltips in a scatter plot.


Effective labels are precise, unambiguous, and reflective of the data they represent. They should tell a story, guiding users from one data point to another, helping them navigate the dashboard, and ultimately, understand the data.
Roles of Dashboard Labels
Dashboard labels have several roles, both functional and aesthetic:


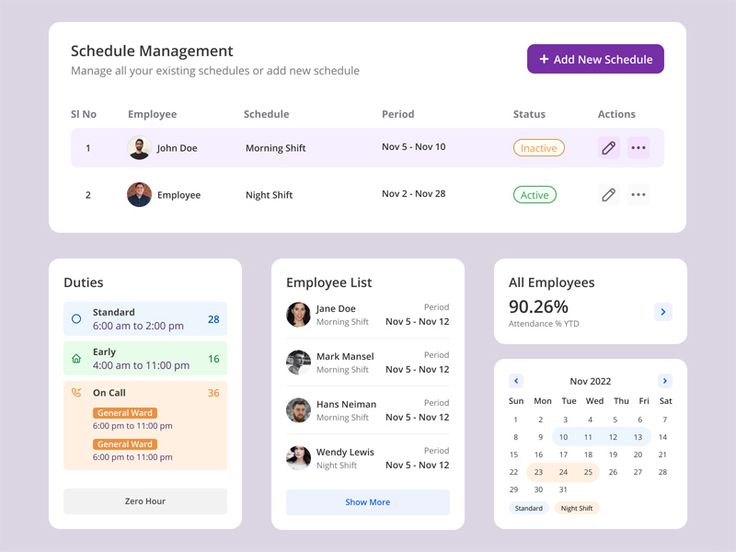
- Data Contextualization: Labels provide context, describing what the data represents. For instance, a line graph labeled "Sales Trends (2020-2021)" makes its purpose clear.
- Data Differentiation: In complex dashboards with multiple visualizations, labels help users distinguish between different data sets.
- Data Navigation: Labels serve as signposts, guiding users through the dashboard and helping them connect related data points.
- Aesthetics and Readability: Well-designed labels enhance a dashboard's visual appeal and readability, improving the user experience.
Key Considerations for Dashboard Labels
Creating effective dashboard labels involves more than just typing a few words. Here are key considerations to enhance their functionality and usability:
- Clarity and Precision: Use straightforward, unambiguous language. Avoid jargon and acronyms that might confuse users.
- Relevance: Ensure labels accurately reflect the data they represent. They should tell users what they need to know about the data.
- ynthia: Keep labels concise but descriptive. Avoid excessive detail but ensure users have enough information to understand the data.
- Consistency: Maintain a consistent labeling style throughout the dashboard. This helps users navigate and understand the data more easily.
Best Practices for Dashboard Labels
To create optimal dashboard labels, consider the following best practices:
Design and Formatting
While a label's function is critical, its design and formatting play significant roles in enhancing its readability and attractiveness:


- Font Size and Style: Use a font size and style that ensures labels are easily readable. Consider using bold or italic fonts to highlight important labels.
- Color and Style: Incorporate color to differentiate between labels and make them stand out. Use consistent color-coding for related labels.
- White Space: Generous use of white space enhances readability and makes the dashboard less cluttered.
Dynamic Labels and Tooltips
In dynamic dashboards, labels aren't always static. Tooltips, for instance, offer additional information when users hover over a data point. Effective use of labels in conjunction with tooltips can significantly improve user experience:
- Tooltips: Use tooltips to provide more detailed information, such as time periods or specific values, without cluttering the main label.
- Context-based Labels: Modify labels based on filters or interactions. For example, if a user selects a specific region, the label could change to reflect that.
A well-designed dashboard with effective labels can make complex data easily understandable and accessible. By following the guidelines outlined above, you can create dashboards that not only present data beautifully but also communicate it effectively.
The world of data is constantly evolving, and so are the tools we use to interact with it. As you explore and experiment with dashboard labels, remember that the best labels are those that help users understand and engage with your data, driving informed decisions and insights.


